20.000+ Bungalows 1.000+ Appartments

Search : Homes, Penthouse, Farmhouse etc.

Property Features

Here you can explain about property features.
  • Low Budget

    Lorem Ipsum is simply dummy text of the printing and typesetting industry.

  • Penthouse

    Lorem Ipsum is simply dummy text of the printing and typesetting industry.

  • Natural Light

    Lorem Ipsum is simply dummy text of the printing and typesetting industry.

  • Public Transport

    Lorem Ipsum is simply dummy text of the printing and typesetting industry.

  • Eco Friendly

    Lorem Ipsum is simply dummy text of the printing and typesetting industry.

  • Fire Proof

    Lorem Ipsum is simply dummy text of the printing and typesetting industry.

  • Nearby Store

    Lorem Ipsum is simply dummy text of the printing and typesetting industry.

  • Secured

    Lorem Ipsum is simply dummy text of the printing and typesetting industry.

    We have Delivered

    1500

    Houses Build

    4150

    Rented House

    860

    Shops Build

    52

    On Progress

    Our Portfolio.

    A creative agency that believes in the power of creative ideas and great design.
    Showing posts with label Paul Beckwith. Show all posts
    Showing posts with label Paul Beckwith. Show all posts

    Friday, January 27, 2017

    Arctic Ocean Feedbacks


    The world is warming rapidly, and the Arctic is warming much more rapidly than the rest of the world. In December 2016, the temperature anomaly from latitude 83°N to the North Pole was 8 times as high as the global anomaly. Above forecast for February 6, 2017, shows that temperatures over parts of the Arctic Ocean will be as much as 30°C or 54°F higher than they were in 1979-2000. How can it be so much warmer in a place where, at this time of year, little or no sunlight is shining? The Arctic Ocean is warming particularly rapidly due to a multitude of feedbacks, some of which are illustrated on the image below.


    As the Arctic is warming more rapidly than the rest of the world, the temperature difference between the Arctic and the northern latitudes decreases, which makes the jet stream wavier. Jennifer Francis has written extensively about jet stream changes as a result of rapid warming in the Arctic. In the video below, Peter Sinclair interviews Jennifer Francis on these changes.


    The changes to the jet stream make it easier for warm air from the south to enter the Arctic and for cold air to move out of the Arctic deep down into North America and Eurasia. At the same time, this also increases the temperature difference between the continents and the oceans, which is quite significant given the rapid warming of oceans across the globe. The result of the greater temperature difference between oceans and continents is that stronger winds are now flowing over the oceans along the jet stream tracks.

    Stronger winds come with more evaporation and rain, which accumulates as freshwater at the surface of the North Atlantic and the North Pacific. The freshwater acts as a seal, as a lid on the ocean, making that less heat gets transferred from underneath the freshwater lid to the atmosphere. This makes that more heat can travel underneath the sea surface through the North Atlantic and reach the Arctic Ocean.


    On January 28, 2017, sea surface temperature anomalies as high as 18.4°C (or 33.1°F) were showing up off the coast of Japan.


    The situation is illustrated by above images, showing areas over the North Atlantic and the North Pacific (blue) where the sea surface was colder than it was in 1981-2011. Over these colder areas, winds are stronger due to the changes to the jet stream. On January 28, 2017, temperature anomalies were as high as 18.4°C (or 33.1°F) off the coast of Japan, while temperature anomalies were as high as 10.9°C (or 19.5°F) near Svalbard in the Arctic on January 27, 2017.

    The image on the right shows sea surface temperature anomalies from 1971-2000.

    The video below shows precipitation over the Arctic, run on January 27, 2017, and valid up to February 4, 2017.


    Beaufort Gyre and Transpolar Drift
    Changes to wind patterns can also affect sea currents in the Arctic Ocean such as the Beaufort Gyre and the Transpolar Drift. In the video below, at around 7:00, Paul Beckwith warns that further loss of sea ice will make these sea currents change direction, which in turn will draw more warm seawater from the North Atlantic into the Arctic Ocean.

    As more ocean heat enters the Arctic Ocean and as sea ice retreats, more heat and water vapor will rise from the Arctic Ocean into the atmosphere over the Arctic. Increased water vapor will make it harder for heat to escape into space, i.e. more heat will remain trapped in the atmosphere and this will add to global warming.


    The changes to the jet stream and the associated changes discussed above all lead to further warming of the Arctic Ocean, next to the warming caused by other feedbacks such as loss of albedo and loss of ice as a heat buffer. Together, sea ice loss and these associated feedbacks could cause global temperatures to rise by 1.6°C by 2026.

    There are further feedbacks affecting the Arctic, as described at this page. One of the most dangerous feedbacks is methane escaping from the seafloor of the Arctic Ocean. As the temperature of the Arctic Ocean keeps rising, it seems inevitable that more and more methane will rise from its seafloor and enter the atmosphere, at first strongly warming up the atmosphere over the Arctic Ocean itself - thus causing further methane eruptions - and eventually warming up the atmosphere across the globe.

    Above image paints a dire warning. The image shows that methane levels were as high as 2562 ppb on January 28, 2017. The image further shows high methane levels off the coast of Siberia and also where water from Nares Strait enters Baffin Bay.

    Feedbacks and further elements of a potential temperature rise by 2026 of more than 10°C above prehistoric levels are further described at the extinction page.

    The situation is dire and calls for comprehensive and effective action as described in the Climate Plan.


    Links

    • Climate Plan
    http://arctic-news.blogspot.com/p/climateplan.html

    • Feedbacks
    http://arctic-news.blogspot.com/p/feedbacks.html

    • Extinction
    http://arctic-news.blogspot.com/p/extinction.html

    • 2016 well above 1.5°C
    http://arctic-news.blogspot.com/2017/01/2016-well-above-1.5c.html

    • Accelerating Warming of the Arctic Ocean
    http://arctic-news.blogspot.com/2016/12/accelerating-warming-of-the-arctic-ocean.html


    Sunday, July 10, 2016

    Extreme Weather Events


    Sea ice close to the North Pole looks slushy and fractured into small pieces. The image below shows the situation on July 8, 2016.

    Sea ice north of the geographic North Pole. For more on the (geo)magnetic North Pole, see this page
    For reference, the bars at the bottom right show distances of 20 km and 20 miles. By comparison, sea ice in the same area did develop large cracks in 2012, but even in September 13, 2012, it was not broken up into small pieces, as shown by this image at a recent post.


    As shown by above image, by Jim Pettit, Arctic sea ice volume has been in decline for decades. While this may look like a steady decline, chances are that the sea ice will abruptly collapse over the next two months, for the reasons described below.

    The animation below, from the Naval Research Laboratory, shows Arctic sea ice thickness for 30 days up through July 8, 2016, including a forecast of 7 days.

    Below is a new Naval Research Laboratory image, dated July 4, 2016
    and contributed by Albert Kallio with the following description.


    NORTH POLE SEA ICE DISAPPEARING VERY RAPIDLY 4.7.2016

    Albert Kallio: The upgraded US Navy sea ice thickness system revealed extreme rates of sea ice pulverization and melting on 4.7.2016 which justifies a continued close attention to the developments on the Arctic Ocean. Due to virtually continuous storm centering the North Pole for weeks now, warm water upswells and sea water mixing drives base melting of icefloes besides wave actions that both wash and pulverize broken sea ice. The more pulverized sea ice becomes, the greater its 3-dimensional surface area that sits in water becomes, this easing transfer of heat from ocean to sea ice. In addition, honeycombing of ice also flushes ice with water in a stormy weather. The final factor being that most of sea ice is very recent (seasonal) ice that contain residues of salts, when saline brine is expelled this creates boreholes into ice making it "rotten ice" easily.
    https://www7320.nrlssc.navy.mil/GLBhycomcice-12/navo/arcticictn_nowcast_anim30d.gif
    Sea ice decline reflects the extra energy added to the Arctic, as global warming and feedbacks are hitting the Arctic particularly strongly. Three of these feedbacks are depicted in the image on the right.

    As the sea ice melts, sea surface temperatures will remain at around zero degree Celsius (32°F) for as long as there is ice in the water, since the extra energy will first go into melting the ice. Only after the ice has melted will the extra energy start raising the temperature of the water.

    Sea ice thus acts as a buffer that absorbs heat, preventing sea surface temperature from rising. As
    sea ice is busy melting, each gram of ice takes 334 Joule of heat to change into water, while the temperature remains steady at 0°C ( 32°F).

    Once all ice has turned into water, all further heat goes into raising the temperature of the water. To raise the temperature of each gram of water by one degree Celsius then takes only 4.18 Joule of heat.

    In other words, melting of the ice absorbs 8 times as much heat as it takes to warm up the same mass of water from zero to 10°C. As sea ice disappears, extra energy instead goes into raising the temperature of the water, as depicted in the image on the right, and as further described at the feedbacks page as feedback #14.

    Sea ice can reflect as much as 90% of the sunlight back into space. Once the ice has melted away, the water of the ocean reflects only 6% of the incoming solar radiation and absorbs the rest. Albedo change is depicted in above image as feedback #1. As Professor Peter Wadhams once calculated, warming due to Arctic snow and ice loss could more than double the net warming now caused by all emissions by all people of the world.

    Professor Peter Wadhams on albedo changes in the Arctic, image from Edge of Extinction
    Once the sea ice has disappeared, a lot more energy will get absorbed by the Arctic Ocean, i.e. energy that was previously reflected back into space and energy that previously went into changing ice into water.

    Furthermore, as the sea ice disappears, chances increase that storms will develop that come with rain and winds that can batter and push the remaining sea ice out of the Arctic Ocean, while storms can also increase the amount of water vapor in the atmosphere and the occurrence of cirrus clouds that can trap heat.

    Methane is a further feedback, depicted as feedback #2 in the image further above. As the water of the Arctic Ocean gets warmer, the danger increases that heat will reach hydrates at the seafloor and that this will trigger release of huge amounts of methane, in an additional self-reinforcing feedback loop that will make warming in the Arctic accelerate further and that threatens to escalate into a third kind of warming, i.e. runaway warming. Peter Wadhams co-authored a study that calculated that methane release from the seafloor of the Arctic Ocean could yield 0.6°C warming of the planet in 5 years (see video at earlier post).


    As above image shows, methane on July 8, 2016, reached levels as high as 2655 ppb. Such high levels typically occur due to methane hydrates getting destabilized. As the sea ice disappears, the situation could get worse rapidly, as illustrated by the images below.

    July 5, 2016, sea surface was as warm as 17.1°C / 62.7°F at green circle, i.e. 13.7°C / 24.7°F warmer than 1981-2011. 
    These high sea surface temperature anomalies are the result of warmer water getting carried by the Gulf Stream below the sea surface of the Atlantic Ocean into the Arctic Ocean. The water carried into the Arctic Ocean is both warmer and saltier than the water at the surface, as the fresh cold meltwater forms a lid at the surface. At areas around Svalbard where the sea is rather shallow, the warmer water comes to the surface. These high anomalies thus indicate how much warmer the water now is that is entering the Arctic Ocean, as discussed in earlier posts such as this one.
    image from previous post
    The rapid recent rise in ocean heat is illustrated by above image, showing that oceans on the Northern Hemisphere in May 2015 through April 2016 were 0.93°C warmer than the 20th century average, whereas for the equivalent 2012 period the anomaly was merely 0.46°C. In other words, there now is more ocean heat, making the possibility of methane hydrates destabilization more threatening.

    Meanwhile, the speed at which the Arctic is warming is changing the jet streams, as discussed by Paul Beckwith in the video below, following Paul's earlier video that's included in an earlier post.


    There are many indications that changes to the climate are accelerating, causing extreme weather events to hit with increasing strength and intensity. Water vapor is a potent greenhouse gas and for each degree Celsius that temperatures rise, the atmosphere can hold 7% more water vapor, which will also lead to stronger storms such as cyclones. On the image below, typhoon Nepartak is approaching Taiwan, with wind speed as high as 103 mph or 165 km/h, and with cloud water as much as 9 kg per square m on July 7, 2016.

    Nepartak approaching Taiwan on July 7, 2016, with wind speed as high as 103 mph or 165 km/h (left panel), and with cloud water as much as 9 kg per square m (right panel)
    NASA image
    According to NASA, very powerful storms near the center of Nepartak's circulation were found to be dropping rain at a rate of over 193 mm (7.6 inches) per hour. Tall thunderstorms called "hot towers" were found to reach heights of 17.0 km (about 10.5 miles).

    The image on the right shows a thermal image of Typhoon Nepartak on July 7 at 17:45 UTC. The colder the cloud tops, the higher they are in the troposphere and the stronger the storms.

    On July 7, 2016, at 1500 UTC, Nepartak's maximum sustained winds had reached 150 knots (172.6 mph/ 277.8 kph), generating waves as high as 48 feet (14.6 meters).

    Strong storms can bring water vapor high up into the stratosphere, contributing to the formation of cirrus clouds that trap a lot of heat that would otherwise be radiated away, from Earth into space.

    Altogether, the combined global temperature rise due to global warming and feedbacks could exceed 10°C or 18°F within a decade, as discussed in previous posts such as this one.

    The situation is dire and calls for comprehensive and effective action as described in the Climate Plan.


    Links

     The North Geographic Pole, the North Magnetic Pole and the North Geomagnetic Pole
    http://wdc.kugi.kyoto-u.ac.jp/poles/polesexp.html

     Three Kinds of Warming in the Arctic
    http://arctic-news.blogspot.com/2016/02/three-kinds-of-warming-in-arctic.html

     NASA: Napartak (July 9, 2016)
    https://www.nasa.gov/feature/goddard/2016/napartak-nw-pacific-ocean

     Jim Pettit Climate Graphs
    http://iwantsomeproof.com/3d/siv-ds-weekly-3d.asp


    Monday, May 2, 2016

    Wildfire Danger Increasing

    Wildfires are starting to break out in British Columbia, Canada. The wildfire on the image below started on May 1, 2016 (hat tip to Hubert Bułgajewski‎).


    The coordinates of the wildfire are in the bottom left corner of above map. They show a location where, on May 3, 2016, it was 26.0°C (or 78.8°F). At a nearby location, it was 27.6°C (or 81.8°F) on May 3, 2016. Both locations are indicated on the map on the right.

    These locations are on the path followed by the Mackenzie River, which ends up in the Arctic Ocean. Wildfires aggravate heat waves as they blacken the soil with soot. As the Mackenzie River heats up, it will bring warmer water into the Arctic Ocean where this will speed up melting of the sea ice.

    Moreover, winds can carry soot high up into the Arctic, where it can settle on the sea ice and darken the surface, which will make that more sunlight gets absorbed, rather than reflected back into space as before.

    The danger of wildfires increases as temperatures rise. The image on the right show that temperatures in this area on May 3, 2016 (00:00 UTC) were at the top end of the scale, i.e. 20°C or 36°F warmer than 1979-2000 temperatures.

    Extreme weather is becoming increasingly common, as changes are taking place to the jet stream. As the Arctic warms up more rapidly than the rest of the world, the temperature difference between the Equator and the North Pole decreases, which in turn weakens the speed at which the north polar jet stream circumnavigates the globe.

    This is illustrated by the wavy patterns of the jet stream in the image on the right, showing the situation on May 3, 2016 (00:00 UTC), with a loop bringing warm air high up into North America and into the Arctic.

    In conclusion, warm air reaching high latitudes is causing the sea ice to melt in a number of ways:
    • Warm air makes the ice melt directly. 
    • Warmer water in rivers warms up the Arctic Ocean. 
    • Wildfires blacken land and sea ice, causing more sunlight to be absorbed, rather than reflected back into space as before.  
    [ click on images to enlarge ]
    The situation doesn't appear to be improving soon, as illustrated by the image on the right. Following the record high temperatures that hit the world earlier this year, the outlook for the sea ice looks bleak.

    Further decline of the snow and ice cover in the Arctic looks set to make a number of feedbacks kick in stronger, with methane releases from the seafloor of the Arctic Ocean looming as a huge danger.

    NSIDC scientist Andrew Slater has created the chart below of freezing degree days in 2016 compared to other years at Latitude 80°N. See Andrew's website and this page for more on this.
    Below is a comparison of temperatures and emissions for the two locations discussed above. Such fires are becoming increasingly common as temperatures rise, and they can cause release of huge amounts of carbon dioxide, carbon monoxide, methane, sulfur dioxide, soot, etc.

    May 3, 2016, at a location north of Fort St John, British Columbia, Canada.
    May 4, 2016, near Fort McMurray, Alberta, Canada.
    The video below shows methane levels (in parts per billion or ppb) on May 3, 2016, pm, starting at 44,690 ft or 13,621 m and coming down to 5,095 ft or 1,553 m altitude. In magenta-colored areas, methane is above 1950 ppb.


    In the video below, Paul Beckwith discusses the situation.


    Wildfires are also devastating other parts of the Earth. Below is an image showing wildfires over the Amur River on May 7, 2016.


    The image below shows carbon monoxide levels over the Amur River as high as 22,480 ppb on May 9, 2016. Hat tip to Grofu Antoniu for pointing at the CO levels. According to this Sputniknews report, a state of emergency was declared in the Amur Region as fires stretched across 12,200 acres.


    The video below shows carbon monoxide emissions in eastern Asia from May 1 to May 26, 2016.

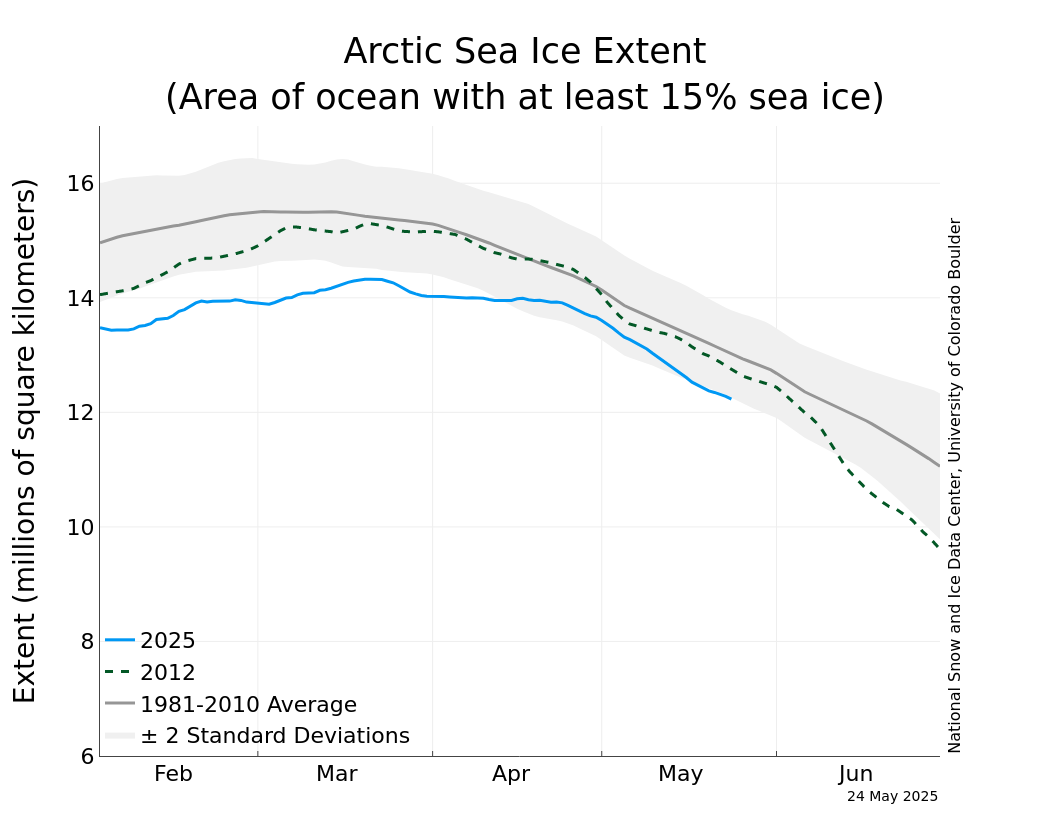
    Meanwhile, the National Snow and Ice Data Center (NSIDC) has resumed daily sea ice extent updates with provisional data. The image below is dated May 5, 2016, check here for updates.

    As illustrated by the image below, from JAXA, sea ice extent on May 6, 2016, was under 12 million square km, more than 15 days ahead on extent in the year 2012, which was 12 million square km on May 21, 2012.


    The situation is dire and calls for comprehensive and effective action as described in the Climate Plan.

    Malcolm Light comments:

    Most natural processes on the Earth are run by convection including plate tectonics that moves the continental and oceanic plates across the surface of the planet. Mother Earth has been able to hold its atmospheric temperature within certain limits and maintain an ocean for more than 3 billion years because each time there was a build up of carbon dioxide in the atmosphere which produced a global fever, Mother Earth it eliminated the living creatures with a massive Arctic methane firestorm that fried them alive. This giant Arctic methane firestorm is a natural antibiotic the Earth uses to rid itself of those creatures that have overproduced carbon dioxide and caused a global fever.

    Essentially mankind has again caused a massive build up of fossil fuel carbon dioxide in the atmosphere and Mother Earth has already started to respond with the predicted massive Arctic methane blow out (since 2010) which will lead to an Earth engulfing firestorm in 5 to 8 years.

    The giant fires in the Fort McMurray region are a result of atmospheric methane induced heating of the Arctic and 93.5% global warming of the oceans that has generated a massive El Nino event this year. Hot winds moving away from these high pressure areas have generated high temperatures and massive fires in Alberta which is a giant fever spot on Earth where mankind has produced the maximum amount of dirty fossil fuel extraction and pollution in Canada.

    Mother Earth will continue to respond more vigorously with her Arctic methane antibiotic to eliminate the humans from her system as we represent nothing more to her than a larger version of an influenza virus which has seriously retarded her oceanic and atmospheric temperature range functioning systems.

    If we do not immediately stop fossil fuel extraction worldwide and control the Arctic methane emission sites we will all be stardust before a decade is past.

    Links

    • The Threat of Wildfires in the North
    http://arctic-news.blogspot.com/2013/06/the-threat-of-wildfires-in-the-north.html

    • Smoke Blankets North America

    Saturday, March 12, 2016

    Interview with Paul Beckwith


    1) Hi Paul. Thanks for agreeing to do this interview. First of all, could you tell us a bit about your background, how long you’ve been involved in climate science, and what areas of climatology you specialize in?


    Hello Sam. Thank you. It is my pleasure to have this interview with you.

    I am an Engineer with a Bachelor of Engineering Degree in Engineering Physics (often called Engineering Science) from McMaster University in Hamilton, Ontario, Canada. I finished at the top of my class and received many scholarships and awards during my studies. My CV can be found on my website http://paulbeckwith.net under the About Me section.

    I am a Physicist with a Master of Science Degree in Laser Physics. My research area was blowing molecules apart with high-powered CO2 lasers and measuring all the chunks flying off with low-power tunable diode lasers. This involved the science of molecular spectroscopy in the infrared region.

    I worked in industry for many years, as a Product Line Manager for optical switching devices in high speed fiber optic communication systems, on high powered Excimer laser research and tunable laser research, and also on software quality assurance for various tech companies.

    I have been interested in climate science my entire life. I decided to formally study it after becoming concerned with the lack of urgency by the public, scientists (literally everybody) about 6 years ago or so.

    I am a part time professor in the Laboratory for Paleoclimatology in the Geography Department at the University of Ottawa. I have taught many courses including climatology, meteorology, oceanography and the geography of environmental issues. My research work in my PhD program is abrupt climate system change in the past and present, to determine what will happen in the near future. I am very active on educating the public about the grave dangers that we face from abrupt climate change, using primarily videos and blogs and public talks (see my website link above). My research is self-funded, apart from my teaching, and I greatly welcome financial contributions at the Please Donate button on the main task bar on my website.

    2) It’s clear that the Arctic is melting rapidly and this trend is likely to continue. When do you predict the Arctic will start to have ice-free conditions? At what point during the year will it disappear, and how long for? How will these conditions develop in future decades, and could we reach a point where the Arctic is free of ice all year round?

    I think that the Arctic will start to have ice-free conditions at the end of the melt season (Septembers) as early as 2020 or before (possibly even the summer of 2016). It is hard to predict a single year, since the loss of Arctic sea ice greatly depends on local Arctic wind and ocean conditions in the summer melt season. These local conditions determine how much ice is lost to export via the Fram Strait and Nares Strait, which makes a huge difference to ice loss amounts during the Northern summer period. When there is less than 1 million square kilometers of sea ice left, we have essentially a “blue-ocean” event in the Arctic.

    For the sake of argument, lets pick September, 2020, for the first “blue-ocean” event in the Arctic (essentially no sea ice left). This would occur for about a month, call it the month of September. Within 2 or 3 years it is highly likely that the duration of this “blue-ocean” state would be 3 months or say, thus occur for August, September and October in 2023. Within an additional few years, say by 2025 it is highly likely that the “blue-ocean” event would be extended for another few additional months, and we would have ice free conditions from July through to and including November; namely for 5 months of the year. Then, within a decade or two from the initial 2020 event we can expect to have an ice free “blue-ocean” Arctic year round; that would be some year between 2030 and 2040.

    Of course if the first “blue-ocean” event occurred in 2016 this timeline would be advanced accordingly.

    3) In recent years, there’s been a lot of talk about methane eruptions in the Arctic and Siberia. How serious is this, in terms of its potential for adding to global warming? Can you give us some idea of the timescales involved? What’s the level of certainty about these future effects?

    Once the Arctic is essentially ice free for ever increasing durations in the summer months, and then over the entire year there are two enormous feedback risks that we face. Methane and Greenland.

    Methane is the mother of all risks. The Russians have measured large increases in emissions from the continental shelf seabed in the Eastern Siberian Arctic Shelf (ESAS). Over the timespan of a few years they observed that methane bubbled up in vast numbers of plumes that increased in size from tens of meters in diameter to hundreds and even thousands of meter diameter plumes in the shallow regions of ESAS. Global atmospheric levels of methane are rapidly rising, and although they average about 1900 ppb or so there have been readings over 3100 ppb in the atmosphere over the Arctic. Since the Global Warming Potential (GWP) of methane versus carbon dioxide is 34x, 86x and close to 200x on timescales of 100 years, 20 years and a few years, respectively a large burst of methane can virtually warm the planet many degrees almost overnight.

    Recently, we have passed about 405 ppm of CO2, with a record rise of 3.09 ppm in 2015 alone. When accounting for methane and other greenhouse gases (GHGs) and putting them into CO2-equivalent numbers, we are at about 490 ppm CO2 – equivalent. We are literally playing with fire, and the outcome will not be pretty.

    Greenland ice melt is the next enormous feedback risk. When we lose snow and ice in the Arctic, and the cascading feedbacks like albedo-destruction kick in, and the methane comes out then the enormous warming over Greenland and in the water around and under the Greenland ice will viciously destroy the ice there and greatly accelerate sea level rise. I refer people to my video from several years ago on the great risk of realizing 7 meters of global sea level rise by 2070 from Greenland and Antarctica melt.

    The level of certainty over these future effects is close to 100% if we continue to be stupid and do nothing. If we are smart we need to have a Manhattan – Marshall plan like emergency status to:
    a) Zero emissions as-soon-as-possible, i.e. by 2030;
    b) Cool the Arctic to keep the methane in place and restore jet stream stability; and
    c) Remove CO2 from the atmosphere/ocean system and remove methane from the atmosphere.
    There is no other choice. I use the metaphor of a three legged bar stool with legs a), b) and c) as above.

    Barstool approach (slightly different from text in that SRM and methane
    removal are included with adaptation and conservation in bottom leg)


    4) What new satellites, monitoring stations, and other science projects are being planned for the future (if any)? How will these improve our knowledge of the Arctic and the various climatic processes in the region?

    NASA, the ESA and the Russians and Chinese are always launching new satellite with better high tech sensors to gather more information on the changes in the Earth System. We need to have a massive increase in scientific study in the Arctic to better quantify what is happening there. However, we know enough to see that if we do not deploy the three-legged barstool approach immediately then our chances are halting our ongoing abrupt climate change will vanish, and emissions from the Earth System will dwarf all cumulative anthropogenic emissions throughout human history. We need the US military budget of $700 to $800 billion dollars per year to be applied to saving human civilization from abrupt climate change.

    5) What can be done to save the Arctic and reverse the melting trend? How long would it take to restore the ice cover to, say, mid-20th century levels? Is this even possible with current technology?

    We must cool the Arctic as soon as possible using Solar Radiation Management (SRM) technologies. We can deploy SRM very quickly if we treat this Arctic temperature amplification as an existential threat to humanity and put billions of dollars into deployment. It will take many years, perhaps a decade to restore the ice cover but we must start now. If we wait until we have “blue-ocean” events before we deploy then our ability to restore the ice will be much harder and perhaps even futile.

    Deployment is possible with current technology. I am specifically referring to Marine Cloud Brightening (MCB) methods. I am working today with people on these technologies.

    6) How does the melting in the Arctic compare to its southern polar opposite, the Antarctic?

    The Arctic is rapidly losing snow cover (mostly in the spring months) and sea ice cover, and is thus the average albedo (reflectivity) of the region is rapidly decreasing. This if feeding back into additional Arctic Temperature Amplification and further darkening and warming, until we have no snow and ice in the region. These vicious feedback cycles have not kicked in to the same extent in the Antarctic. The ice cap there is losing ice causing a rise in sea level mostly from the warming of the seawater undercutting the ice on land that is grounded below sea level. However, since the Arctic is warming so fast due to increased solar radiation absorption (from darkening) there is less heat transported there via the atmosphere and oceans. Thus, jet streams and ocean currents are slowing. Thus, more heat is moving from the equator to the southern hemisphere, making it to Australian latitudes and increasing the temperature gradient to Antarctica and thus increasing the speed of the jet streams there.

    7) Finally, what’s your message to climate change deniers who reject the science and believe the whole thing is a giant hoax?

    Climate change deniers cannot be tolerated by society any longer. They are threatening the future of everybody on our planet. Send them all to Guantanamo for intensive and mandatory climate science basic training, and when they get clued in they can be reintroduced into society.


    Interview with Paul Beckwith http://arctic-news.blogspot.com/2016/03/interview-with-paul-beckwith.html
    Posted by Sam Carana on Saturday, March 12, 2016

    Sunday, May 31, 2015

    Arctic Methane Skyrocketing

    The map below shows observatories in the Arctic.


      'Arctic methane skyrocketing' is the title of a video by Paul Beckwith discussing recent rises in methane levels in the Arctic.


      Paul's description: "I discuss how ground level flask measurements of methane have been spiking upwards over the last few years. I analyze the implications to the breakdown of climate stability, causing jet stream fracturing and weather regime change. I believe that this behaviour will rapidly worsen as Arctic temperature amplification continues, leading our planet to a much warmer and unrecognizable climate over the next 5 to 10 years."

      Below are some NOAA images showing methane levels (surface flasks) recorded at Arctic observatories.


      Below is an image showing hourly average in situ measurements at Barrow, Alaska, including one very high reading, from an earlier post.


      The image below shows sea surface temperature anomalies in the Arctic on May 30, 2015.


      The situation is dire and calls for comprehensive and effective action, as discussed at the Climate Plan page.


      Sea surface temperature anomalies in the Arctic on May 30, 2015. From the post: 'Arctic Methane Skyrocketing' http://arctic-news.blogspot.com/2015/05/arctic-methane-skyrocketing.html

      Posted by Sam Carana on Sunday, May 31, 2015

      Sora

      • Street :Lane Road 00
      • Person :Person
      • Phone :+012 345 678 910
      • Country :ENGLAND
      • Email :soratemplate@gmail.com

      Get in Touch

      Feel free to drop us a line to contact us

      Contact Form

      Name

      Email *

      Message *


      Feel free To Contact

      Lorem ipsum dolor sit amet, consectetur adipisicing elit. Voluptate dolores, quasi unde quisquam facilis at ullam aperiam similique dicta voluptatibus!

      • 3066 Stone Lane, Wayne, Pennsylvania.
      • +610-401-6021, +610-401-6022
      • soratemplate@gmail.com
      • www.soratemplates.com

      Pages