20.000+ Bungalows 1.000+ Appartments

Search : Homes, Penthouse, Farmhouse etc.

Property Features

Here you can explain about property features.
  • Low Budget

    Lorem Ipsum is simply dummy text of the printing and typesetting industry.

  • Penthouse

    Lorem Ipsum is simply dummy text of the printing and typesetting industry.

  • Natural Light

    Lorem Ipsum is simply dummy text of the printing and typesetting industry.

  • Public Transport

    Lorem Ipsum is simply dummy text of the printing and typesetting industry.

  • Eco Friendly

    Lorem Ipsum is simply dummy text of the printing and typesetting industry.

  • Fire Proof

    Lorem Ipsum is simply dummy text of the printing and typesetting industry.

  • Nearby Store

    Lorem Ipsum is simply dummy text of the printing and typesetting industry.

  • Secured

    Lorem Ipsum is simply dummy text of the printing and typesetting industry.

    We have Delivered

    1500

    Houses Build

    4150

    Rented House

    860

    Shops Build

    52

    On Progress

    Our Portfolio.

    A creative agency that believes in the power of creative ideas and great design.
    Showing posts with label sea. Show all posts
    Showing posts with label sea. Show all posts

    Monday, April 2, 2018

    How much warmer is it now?

    The IPCC appears to be strongly downplaying the amount of global warming that has already occurred and that looks set to eventuate over the next decade or so, according to a leaked draft of the IPCC 'Special Report on 1.5°C above pre-industrial'. The 'First Order Draft of the Summary for Policy Makers' estimates that the global mean temperature reached approximately 1°C above pre-industrial levels around 2017/2018.

    Let's go over the numbers step by step, by following the image below line by line (click on the image to enlarge it).

    NASA's data for the two most recent years for which data are available (2016/2017) show a warming of 0.95°C when using a baseline of 1951-1980 and a warming of 1.23°C when using a baseline of 1890-1910 (left map on image below). In other words, using this earlier baseline results in an additional 0.28°C rise. When using an even earlier baseline, i.e. 1750 or preindustrial, it could be 1.53°C warmer, as discussed in an earlier post.


    In other words, merely changing the baseline to preindustrial, as agreed to at the Paris Agreement, can show that we're already above the 1.5°C guardrail that the Paris Agreement had pledged we should not cross.

    There's more! As a recent publication points out, most methods that calculate the global temperature use sea surface temperatures. However, doesn't it make more sense to calculate the temperature of the air just above the sea surface? Measuring air temperature at the surface is done in the case of temperatures over land, where one doesn't measure the temperature of the soil or rocks when telling people how warm it is. Since air surface temperatures are slightly higher than sea surface temperatures, the result of looking at air surface temperatures across the globe would be a temperature that is approximately 0.1°C warmer. Furthermore, many areas in the Arctic may not have been adequately reflected in the global temperature, e.g. because insufficient data were available. Since the Arctic has been warming much faster than the rest of the world, inclusion of those areas would add another 0.1°C to the rise. Adding this to the above 1.53°C rise makes that it's already 1.73°C (or 3.11°F) warmer than preindustrial.

    Another question is over what period measurements should be taken when assessing whether thresholds have been crossed. When focusing on temperatures during specific months, the rise could be much higher than the annual average. So, does it make more sense to look at a monthly peak rather than at a long-term average?

    When building a bridge and when calculating what load the bridge should be able to handle, it makes sense to look at peak traffic and at times when a lot of heavy trucks happen to be on the bridge. That makes a lot more sense than only looking at the average weight of cars driving over the bridge during a period of - say - one, two or thirty years.


    Accordingly, the right panel of the top image shows numbers for February 2016 when temperature anomalies were particularly high. When looking at this monthly anomaly, we are already 2.37°C (or 4.27°F) above preindustrial, i.e. well above the 2°C guardrail that the Paris Agreement had pledged we should definitely not cross.

    Should the temperature rise be calculated using a longer period? The IPCC appears to have arrived at its temperature rise estimate by using an extrapolation or near term predictions of future warming so that the level of anthropogenic warming is reported for a 30 year period centered on today.

    The image below, from an earlier post, shows global warming for a 30-year period centered on January 2018, using NASA 2003 to January 2018 LOTI anomalies from 1951-1980, adjusted by 0.59°C to cater for the rise from preindustrial to 1951-1980, and with a polynomial trend added.


    If above trendline is adjusted by a further 0.2°C, by shifting to air temperatures instead of sea surface temperatures, and by better reflecting Arctic temperatures, then the trendline looks set to cross the 2°C guardrail in 2018. So, will Earth cross 2°C in 2018?


    Above images illustrate the importance of what's going to happen next. The temperature rise up until now may well be dwarfed by what's yet to come and the outlook may well be even worse than what most fear will eventuate. The image below, from an earlier post, shows a steep rise from 2016 to 2026, due to the combined impact of the warming elements listed in the left box of the image below.


    Meanwhile, the rise in carbon dioxide levels appears to be accelerating, as illustrated by the images below.


    Indeed, despite pledges made at the Paris Agreement to limit the temperature increase to 1.5°C above pre-industrial, the rise in CO₂ since preindustrial, i.e. 1750, still appears to be accelerating.


    On March 18, 2018, the sea surface temperature near Svalbard (at the green circle) was 16.7°C or 62.1°F, i.e. 14.7°C or 26.4°F warmer than the daily average during the years 1981-2011.


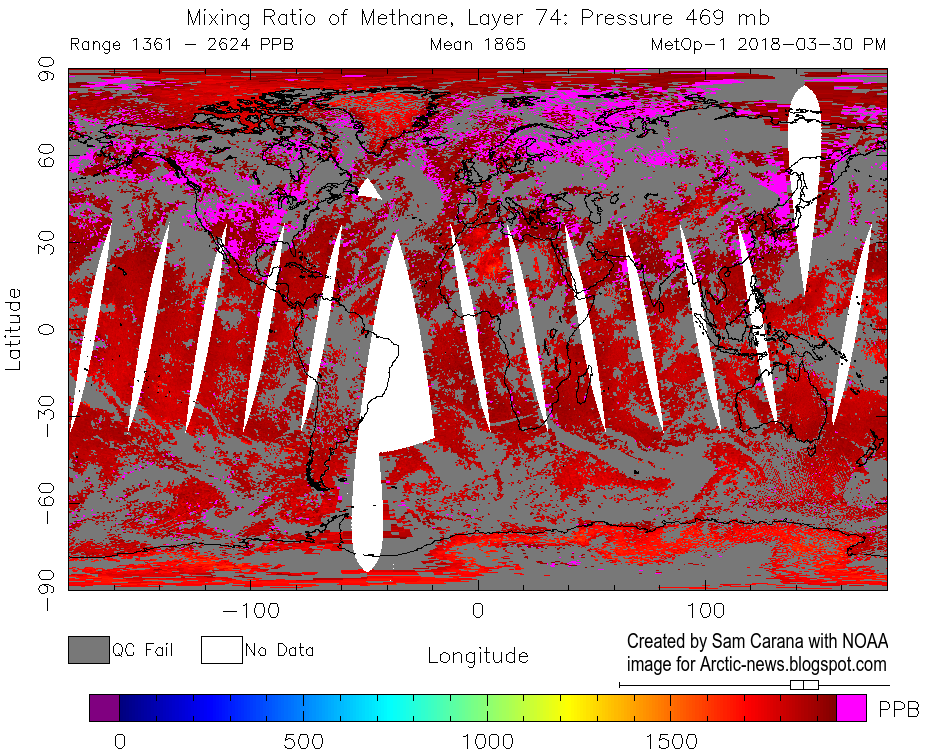
    On March 30, 2018, methane levels as high as 2624 parts per billion were recorded.

    On April 1, 2018, methane levels as high as 2744 parts per billion were recorded.


    The situation is dire and calls for comprehensive and effective action, as described in the Climate Plan.


    Links

    • Climate Plan
    https://arctic-news.blogspot.com/p/climateplan.html

    • Extinction
    https://arctic-news.blogspot.com/p/extinction.html

    • How much warming have humans caused?
    https://arctic-news.blogspot.com/2016/05/how-much-warming-have-humans-caused.html

    • IPCC seeks to downplay global warming
    https://arctic-news.blogspot.com/2018/02/ipcc-seeks-to-downplay-global-warming.html

    • 2016 well above 1.5°C
    https://arctic-news.blogspot.com/2017/01/2016-well-above-1.5c.html

    • Interpretations of the Paris climate target, by Andrew Schurer et al.
    https://www.nature.com/articles/s41561-018-0086-8


    Saturday, September 3, 2016

    Action must be taken now


    Some of the world's most preeminent climate scientists, all experts with many decades of experience in their respective field, are warning that effective action must be taken now to avoid catastrophe.

    These scientists, and many others, have made valuable and much-appreciated contributions to the Arctic-news blog over the years [note: contributors each express their own views in posts and may or may not endorse other content of this blog].

    Sam Carana, editor of this blog, has for years supported the calls of these scientists, also discussing and sharing their calls at facebook groups such as Arctic-News, Electric TransportRenewables and Climate Alert.


    Furthermore, Sam Carana has called for specific action for years, including support for biochar, preferably through feebates. More specifically, Sam Carana recommends that revenues raised from fees imposed on sales of livestock products, nitrogen fertilizers and Portland cement are used to fund support for soil supplements, as illustrated by above image. For more on biochar, see this blog and this facebook group.

    For years, Sam Carana has also called for more R&D in specific areas of geo-engineering. For more on this, see this blog and this facebook group.

    More generally, Sam Carana advocates the Climate Plan, which calls for a global commitment to parallel lines of action while seeking to delegate implementation to local communities, preferably through effective policies such as local feebates.

    This blog has had some success in spreading this message. To date, Sam Carana has received 82,327,368 views at Google plus (see screenshot on the right), while this blog has received 3,255,445 views (see update of views in the panel further on the right).

    Your continued support is needed to share this message, so please join one or more of the above-mentioned groups, and share and like the images of this post in emails, on facebook and other social media.

    Regarding the urgency to act, the images below give an update on the terrifying situation in the Arctic, where the sea ice is disappearing fast.

    The decline of the snow and ice cover in the Arctic goes hand in hand with rising sea surface temperatures that contribute to sea ice getting ever thinner.

    The image on the right show Arctic sea ice on September 1, 2016, with thickness in meters.

    The warming of the oceans is illustrated by the images below.

    The image directly below shows sea surface temperature (left) and anomalies compared to 1981-2011 (right).


    The image below also shows sea surface temperature anomalies, this time compared to 1971-2000.


    Global warming has hit the Arctic particularly hard over the past 365 days, with anomalies exceeding the top end of the scale over most of the Arctic Ocean, as illustrated by the image below.


    The situation is dire and calls for comprehensive and effective action as described at the Climate Plan.

    Monday, July 4, 2016

    2016 Arctic Sea Ice Headed To Zero

    The image below shows that Arctic sea ice extent on July 3, 2016, was 8,707,651 square km, i.e. less than the 8.75 million square km that extent was on July 3, 2012.


    In September 2012, Arctic sea ice extent reached a record low. Given that extent now is only slightly lower than it was in 2012 at the same time of year, can extent this year be expected to reach an even lower minimum, possibly as low as zero ice in September 2016?

    The ice this year is certainly headed in that direction, given that the sea ice now is much thinner than it was in 2012. The image below shows sea ice thickness on July 7, 2012, in the left-hand panel, and adds a forecast for July 7, 2016 in the right-hand panel.


    Besides being thinner, sea ice now is also much more slushy and fractured into small pieces. The animation below shows that the sea ice close to the North Pole on July 4, 2016, was heavily fractured into pieces that are mostly smaller in size than 10 x 10 km or 6.2 x 6.2 miles. By comparison, sea ice in the same area did develop large cracks in 2012, but even in September 13, 2012, it was not broken up into small pieces.


    One big reason behind the dire state the sea ice is in now is ocean heat. On July 2, 2016, sea surface near Svalbard (at the location marker by the green circle) was as warm as 16.7°C or 62.1°F, i.e. 13.5°C or 24.3°F warmer than 1981-2011. This gives an indication how much warmer the water is that is entering the Arctic Ocean.


    As the sea ice disappears, less sunlight gets reflected back into space, resulting in additional warming of the Arctic Ocean. In October 2016, the sea ice will return, sealing off the Arctic Ocean, resulting in less heat being able to escape, at the very time the warmest water is entering the Arctic Ocean from the Atlantic and Pacific Oceans. The danger of this situation is that a large amount of heat will reach the seafloor and destabilize hydrates, resulting in huge abrupt methane releases that will further contribute to warming. When adding in further factors such as discussed e.g. at this earlier post, this adds up to a potential temperature rise of more than 10°C or 18°F compared to pre-industrial times in less than ten years time from now.

    The situation is dire and calls for comprehensive and effective action, as described at the Climate Plan.


    Tuesday, April 5, 2016

    Record Arctic Warming

    On April 3rd, 2016, Arctic sea ice extent was at a record low for the time of the year, reports the National Snow and Ice Data Center (NSIDC).

    The image below, created with an image from the JAXA site, gives an update on sea ice extent.


    Besides sea ice extent, sea ice area is important. For more on what constitutes "ice-covered" and what is sea ice extent (versus sea ice area), see this NSIDC FAQ page.

    Another measure is sea ice area. On April 2nd, 2016, Northern Hemisphere sea ice area was at a record low for the time of the year, reports the Cryosphere Today.


    In 2015, there still was more sea ice area than there is now when it was half a month later (15 days) into the year. In 2012, there still was more sea ice when it was 25 days later in the year. In other words, sea ice area decline is almost one month ahead compared with the situation in 2012.

    NSIDC scientist Andrew Slater has created the chart below of freezing degree days in 2016 compared to other years at Latitude 80°N. See Andrew's website and this page for more on this.

    The Arctic has warmed more than elsewhere on Earth. Surface temperatures over the past 365 days were more than 2.5°C or 4.5°F higher than they were in 1981-2010.


    The image below compares sea ice thickness on April 3rd for the years 2012, 2015 and 2016 (respectively the left, center and right panel).


    Sea ice thickness has fallen dramatically over the years, as illustrated by the image on the right, from NSIDC, showing Arctic sea ice age for the week from March 4 to 10, from 1985 to 2016.

    The high temperatures that have hit the Arctic Ocean over the past 365 days make that the outlook for the sea ice in the Arctic this year is not good.

    As illustrated by the image on the right, the current El Niño is still going strong, with temperatures above 100°F recorded in three continents.

    The year 2016 is already shaping up as the warmest year on record by far.

    Temperatures look set to soar over the coming months, over the Northern Hemisphere at large and over the Arctic in particular.

    The image below shows that over a 90-day period from January 13, 2016, to April 11, 2016, most of the Arctic Ocean was more than 6°C (10.8°F) warmer than 1981-2011.

    The DMI image below shows recent melting in Greenland up to April 11, 2016. Maps in the left panel show areas where melting has taken place on April 10 and April 11, 2016. The chart in the right panel shows 2016 melting (blue line), against the 1990-2013 average (the vertical axis reflects the percentage of the total area of the ice where the melting occurred).

    As a recent study confirms, ice sheets can contain huge amounts of methane in the form of hydrates and free gas. Much methane can escape due to melting and fracturing during wild weather swings.


    Rapid melting on Greenland looks set to continue. The forecast for April 12, 2016 (0000 UTC), on the right shows temperature anomalies at the top end of the scale (20°C or 36°F) over most of Greenland and Baffin Bay, while the Arctic as a whole is hit by a temperature anomaly of over 5°C (over 9°F), compared to 1979-2000.

    Furthermore, ocean temperatures are currently very high. These high temperatures, together with the poor condition of the sea ice, make that chances are that the sea ice will be largely gone by September 2016.

    [ click on images to enlarge them ]
    The image on the bottom right shows sea surface temperature anomalies above Latitude 60°N on April 4, 2016.

    The image below shows that, on April 7, 2016, sea surface in the Barents Sea was as warm as 10.1°C or 50.2°F, an anomaly of 9.4°C or 16.9°F from 1981-2011 (at the location marked by the top right green circle), while there were anomalies as high as 11.3°C or 20.3°F off the coast of North America (green circle bottom left).

    The white line shows the approximate path of the cold exit current, while the red line shows the approximate path of the warm entry current.

    The high temperatures in the Barents Sea give an indication of the ocean heat traveling toward the Arctic Ocean, while the high temperature anomalies off the east coast of North America give an indication of the heat that is building up there. Much of this heat will make its way to the Arctic Ocean over the coming months


    April 11, 2016: SST anomalies as high as 11.6°C or 20.8°F
    In the Pacific, sea surface temperature anomalies from 1981-2011 were as high as 11.6°C or 20.8°F near Japan on April 11, 2016 (see image right), giving a further indication of the huge amount of additional heat that there now is in oceans on the Northern Hemisphere. The prospect is that temperatures will rise over the next few months to levels even higher than they were last year (see earlier post on temperatures in June 2015).

    Sea ice acts as a buffer, absorbing heat and keeping the temperature of the water at freezing point. Without such a buffer, further heat will instead make that the temperature of the water will rise rapidly. Furthermore, less sea ice means that less sunlight gets reflected back into space and more sunlight instead gets absorbed by the Arctic Ocean.

    These are just some of the many feedbacks that accelerate warming in the Arctic. Warm water reaching the seafloor of the Arctic Ocean can penetrate sediments that can contain huge amounts of methane in the form of hydrates and free gas, triggering abrupt release of methane in gigantic quantities, escalating into runaway warming, and subsequent destruction and extinction at massive scale.

    On a 10-year timescale, the current global release of methane from all anthropogenic sources already exceeds all anthropogenic carbon dioxide emissions as agents of global warming; that is, methane emissions are more important than carbon dioxide emissions for driving the current rate of global warming.


    Above image shows that growth in methane levels has been accelerating recently; a trendline points at a doubling of methane levels by the year 2040. Unlike carbon dioxide, methane's GWP does rise as more of it is released. Methane's lifetime can be extended to decades, in particular due to depletion of hydroxyl in the atmosphere.

    The situation is dire and calls for comprehensive and effective action as described at the Climate Plan.

    Albert Kallio comments: 
    More could have been added from the last National Snow and Ice Data Center (NSIDC) Arctic sea ice report for March, the general outlook for massive sea ice loss because the near-all-time record low marine snow and ice cover is coinciding with near-all-time record low terrestrial snow cover. NSIDC forecast that due to dark surfaces being so high, this easily leads to loss of sea ice. In fact, 2016 situation is even worse that it was previous record loss 2012 when snow cover was much larger. Same in 2007 when the sea ice area was slighly smaller, there was much larger terrestrial snow cover. Furthermore, neither 2007 nor 2012 occurred during strong El Nino like 1998. El Nino 2015-2016 is the strongest ever, also accompanied by the very warm Indian Ocean, Atlantic Ocean, and Southern Ocean around Antarctica. At times Antarctic sea water temperatures were also high leading to second smallest Austral summer sea ice at one point. Sea ice area also around Antarctica has been smaller than average most of time, despite increased melt water and reduced salinity - due to high temperatures. All these additional factors should be added into your conclusions without forgetting to mention that the added heat in the earth system is ripping the Polar Vortex apart as the jet streams have started to blend into other irregular atmospheric wind patters. Note also the increased flow of sea ice through the Fram Strait due to lowered spatial viscosity of sea ice that also results from larger wave action, vertical mixing of ocean by wind, thinner sea ice breaking easier apart and collapsing into pack ice, as well as being mostly seasonal ice (containing trace amounts of salts that make the chemical bounds in ice crystals weaker and fragile and melting easier), May be you can update and rejoice on NSIDC's March 2016 report noting all the points therein..

    On April 3rd, 2016, Arctic sea ice extent was at a record low for the time of the year, further confirming that the...
    Posted by Sam Carana on Tuesday, April 5, 2016

    Thursday, February 18, 2016

    Has maximum sea ice extent already been reached this year?

    An earlier post wondered whether maximum extent for this year had already been reached, i.e. on February 9, 2016, when sea ice extent was 14.214 million km2.

    As illustrated by the image below, extent since has been lower, including on the two most recent days on the image, i.e. on February 16 and 17, 2016, when extent was respectively 14.208 and 14.203 million km2.


    Last year (2015), maximum sea ice extent was reached on February 25. That's close to the most recent date on the image of February 17, so with El Nino still going strong, it may well be that the maximum in 2016 will be reached early.

    On the other hand, strong winds could spread out the sea ice and speed up its drift out of the Arctic Ocean, which may result in a larger extent, but which won't do much to strengthen the sea ice.

    UPDATES: On February 18, 2016 (arrow), Arctic sea ice extent was 14.186 million square km, i.e. less than it was on February 9. In fact, sea ice extent hasn't been higher on any day since February 9, 2016. So, the question is, has this year's maximum extent already passed us by (i.e. on February 9)?

    The image below shows the heat is having a huge impact on the sea ice, with some areas (black) showing sea surface temperature anomalies above 8°C (or above 14.4°F).


    Ominously, sea surface off the North American east coast was as much as 11.8°C or 21.3°F warmer on February 19, 2016, than it was in 1981-2011 (at the location marked by the green circle in the image below).


    Temperatures over the Arctic Ocean are forecast to remain extremely high for the next five days, with anomalies in a large part of the Arctic Ocean at the top end of the scale, i.e. 20°C or 36°F.


    As the image below shows, Arctic sea ice area was at a record low for the time of year on February 18, 2016.


    The image below shows that Arctic sea ice extent on February 20, 2016, was only 14.166
    million km2 (arrow), adding to fears that this year's maximum was already reached on February 9.


    The image below shows that Arctic sea ice extent on February 21, 2016, was only 14.160
    million km2 (arrow), further fueling fears that this year's maximum was already reached on February 9.


    Meanwhile, very high methane levels, as high as 3096 parts per billion, were recorded on February 20, 2016, as shown by the image below.


    Further analysis indicates that these high levels likely originated from destabilizing methane hydrates in sediments, from a location about latitude 85°North and longitude +105° (East), on the Gakkel Ridge, just outside the East Siberian Arctic Shelf, at the location of the red marker on the map below.

    Below is a comparison map, from grida.no
    for large-size image, go to grida.no
    Below is a map with sea surface temperature anomalies on February 20, 2016. The green circle marks the likely location of sediment destabilization and subsequent methane plume, at about latitude 85°North and longitude +105° (East), on the Gakkel Ridge, just outside the East Siberian Arctic Shelf.

    zoom in and out at nullschool.net
    If you like, you can discuss this further at the Arctic News group or below.


    On February 18, 2016 (arrow), Arctic sea ice extent was 14.186 million square km, i.e. less than it was on February 9....
    Posted by Sam Carana on Friday, February 19, 2016

    Sora

    • Street :Lane Road 00
    • Person :Person
    • Phone :+012 345 678 910
    • Country :ENGLAND
    • Email :soratemplate@gmail.com

    Get in Touch

    Feel free to drop us a line to contact us

    Contact Form

    Name

    Email *

    Message *


    Feel free To Contact

    Lorem ipsum dolor sit amet, consectetur adipisicing elit. Voluptate dolores, quasi unde quisquam facilis at ullam aperiam similique dicta voluptatibus!

    • 3066 Stone Lane, Wayne, Pennsylvania.
    • +610-401-6021, +610-401-6022
    • soratemplate@gmail.com
    • www.soratemplates.com

    Pages